Post

Avatar
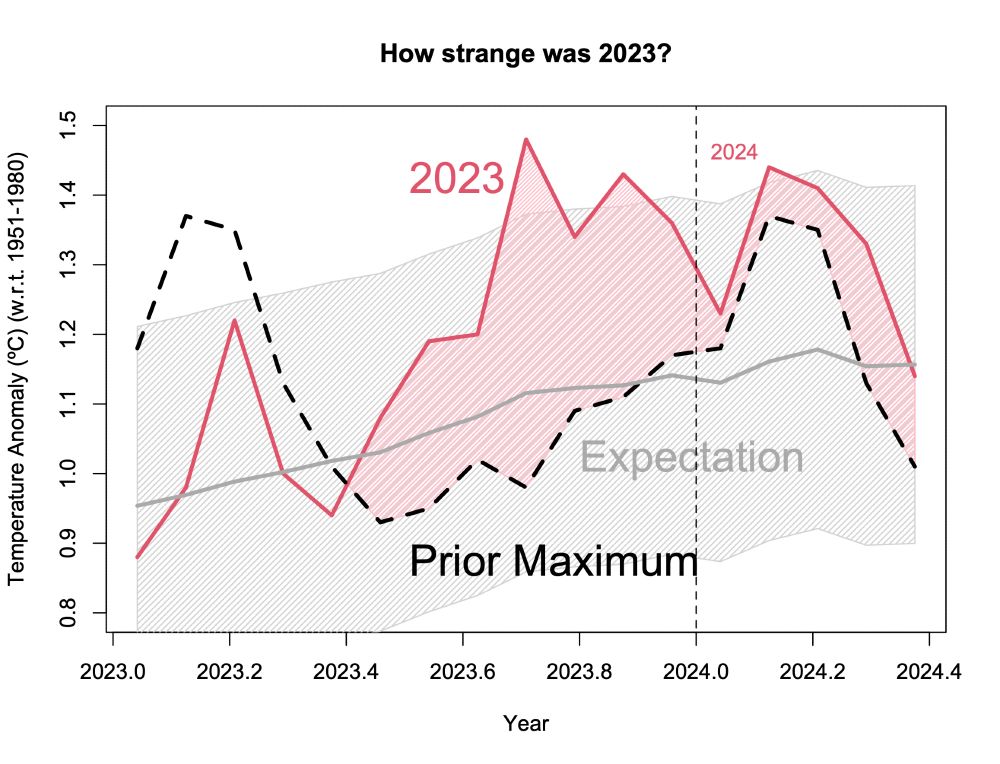
After another record month of global temperatures, are there signs that we are now over the 2023 hump? Possibly. 🧪 1. Temperatures are now much closer to prior expectations (based on ENSO and long term trends) than they have been.
Avatar
2. The net energy imbalance peaked in June of 2023 and has been reducing ever since (as the outgoing LW increased as a function of the warming temperatures, and also the absorbed shortwave decreased a little).
Avatar
3. Nonetheless, 2024 is looking likely to top 2023 in the rankings, though with the anticipated La Niña event, the odds are around 60:40.
Avatar
Further, noteworthy that thermal stratification went trough the roof in 2023 mostly over the first 300m - mentioned in the text: "New Record Ocean Temperatures and Related Climate Indicators in 2023" link.springer.com/article/10.1...
Avatar
marine heatwaves causing a cloud feedback: Change in cloud coverage was the primary cause of sea surface temperature variations, and clouds provided a positive feedback to temperature variations Observational and Model Evidence for Positive Low-Level Cloud Feedback www.science.org/doi/10.1126/...
Observational and Model Evidence for Positive Low-Level Cloud Feedbackwww.science.org Decreased low-level cloud cover in the Northeast Pacific region amplifies increases in sea surface temperatures.
Avatar
And sorry Gavin for all these posts but it is quite complex especially as I left out the pattern effect of surface temperatures and global circulation changes, low- and high-pressure systems and blocking events...
Avatar
Other aspects of this feedback: 1: Warming in the pipeline in the oceans now increasingly being released back to the atmosphere (subsurface warm water masses accumulating and freshening) 2: Ocean heat uptake will eventually decline/shifted ratio to shallower depths
Avatar
Was just the most simplest overview - but we are now closing in on a physical runaway climate warming if the precarious principle is applied we have to prove that it is not happening. Mixed-layer depth is discussed controversial-but nobody can explain how stratification goes up and MLD gets thicker
Avatar
Non-surprisingly as SSTs are non-linear connected to evaporation we got a jump in water vapor content the last months by >5% accordingly to NASA - source: psl.noaa.gov/cgi-bin/data...
psl.noaa.gov
Avatar
On top we get a non-linear water vapor signal driven by higher SSTs-first observation over the marine boundary layer-non-linear jump from 2012-2016 Changes in Relative Humidity Profiles over Earth’s Oceans in a Warming Climate: A Satellite-Data-Based Inference"; journals.ametsoc.org/view/journal...
journals.ametsoc.org
Avatar
SSTs produce a SW cloud feedback which supports an energy uptake by the oceans and thereby a faster warming of the upper ocean what was the start of our problem - upper oceans accumulates faster heat than the lower ocean - stratification increases MLD decreases (seasonal?) - barrier layers important
Avatar
Avatar
And here comes the catch: marine heatwaves are now being discussed as being a feedback of global warming caused by increasing stratification of the upper ocean and declining mixed layer depth: "Human-induced intensified seasonal cycle of sea surface temperature"; www.nature.com/articles/s41...
Human-induced intensified seasonal cycle of sea surface temperature - Nature Communicationswww.nature.com The authors reveal a 3.9% intensification in the sea surface temperature seasonal cycle over the past four decades, with hotspot regions experiencing intensification of up to 10%. This intensification...
Avatar
Avatar
Now a study on Earths Albedo driving the warming in 2023 - by some ~0.2°C - Preprint - Cloud feedback - Nice graphs they have - here fig. 1 - fits perfect SSTs and MHWs and positive IOD "Recent global temperature surge amplified by record-low planetary albedo"; arxiv.org/abs/2405.19986
Avatar
Here a graph how the EEI went up with SSTs over the North Atlantic Ocean: Source: "A Glimpse into the Future: The 2023 Ocean Temperature and Sea Ice Extremes in the Context of Longer-Term Climate Change"; journals.ametsoc.org/view/journal...
Avatar
Avatar
Gotta watch out for that drying latent heat... what's with all the focus on ocean anyway? Aren't the changes much more pronouned over land?
Avatar
If you mean by "drying latent heat" the soil-moisture-temperature cascade over large continental regions its indeed one of the main problems as everything gets sucked dry if temperatures go up while relative humidity driven by extreme low soil moisture goes down...
Avatar
did I read correctly that you list both marine heatwaves with increased latent heating and continental drying with reduced latent heating as having the same effect on clouds? You said "Latent heat release by warmer oceans dries up the upper boundary layer"
Avatar
Both is now very worrisome - droughts and heat becoming a serious issue in recent years but also flooding and storms And all these extreme events can be supported by warmer oceans And as our climate system is in principle a steam engine, warmer SSTs are a serious problem fueling all the others...
Avatar
Avatar
Hi Gavin, if you have time, could you post the graph of the recent shortwave absorption - it started to decrease from October 2023 onward - fitted with cloud feedback of MHW and drying out continents during the warm months - so would be interesting what it is doing now... All the best!
Avatar
is of paramount importance
Avatar
What is important here that the cloud feedback in 2023 was caused by drying out continental regions (e.g. Canada, Amazon rainforest) caused/reinforced by the soil-moisture-temperature cascade, and the cloud feedback over marine heatwaves. I will attack some studies on the topic as to understand 2023
Avatar
What is interesting that absorbed shortwave radiation decreased in October 2023 - at least from Hansen's post "Global Warming Acceleration: Hope vs Hopium" Fig. 7 Source of the pic: www.columbia.edu/~jeh1/mailin...
Avatar
Nach El Niño jetzt der La Niña Effekt?
Avatar
Avatar
Is the dashed the prior maximum? Is that maximum for each month or the overall maximum year? Why is it lower than the expectations in some months?
Avatar
Yes. Dashed lines are the prior records (mostly 2016 or 2020) for each month separately. The expectation is driven by the long term trend and an effect from ENSO. If that is higher than the previous record, it implies we expected a new record!
Avatar