Post

Avatar
the climate story right now is in a very weird state of flux a) the warming we've priced in is bad and really starting to show itself b) the renewable story is astoundingly good and getting better we are left with "warming is going to get worse but almost certainly not as much as it could have"
it's always important to demand better, but part of the reason that the story of climate policy isn't sticking is partly because bad news feels more plausible and partly because the people most invested in this policy understand its limits. www.notus.org/biden-2024/v... hard to sell "mixed-positive"
Biden’s Record Is Full of Climate Wins — So Why Don’t Voters Know It?www.notus.org Environmental groups are making a concerted effort to educate voters about President Joe Biden’s climate policies ahead of the election.
Avatar
I'm old enough to remember the forecasts in the 90s, which make the forecasts today seem like a utopia, and every estimate seems to underestimate the speed of the energy transition. i.e. things are bad. things are getting better. they can be getting better still. we have control over that.
Avatar
Avatar
Avatar
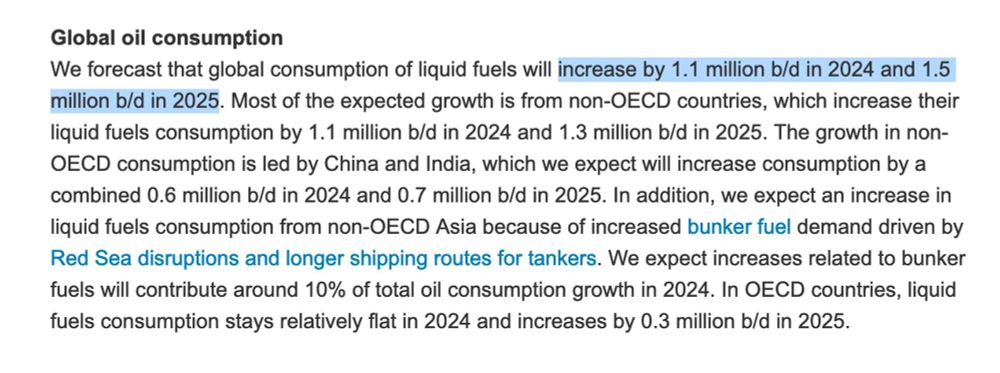
Here, one from the EIA which you linked:
Avatar
what is that as a fraction of current global liquid fuel usage? and how has that trend changed over time?
Avatar
The CO2 chart answers that nicely. It's not good!
Avatar
so the argument you're putting forward is that, because the world has no abandoned petroleum as a fuel source over the course of a year or two, the situation is not improving?
Avatar
I am showing data that regardless of any label you would like to assign, the situation is not improving. It is a global problem, and we can celebrate the battles we win but we are losing the war. You can accept it or deny it. www.co2.earth/monthly-co2
Monthly CO2www.co2.earth 426.90 ppm CO2 in atmosphere in May 2024 at the Mauna Loa Observatory. Monthly comparison of CO2 levels measured by NOAA & Scripps at Mauna Loa. Plus global averages.
Avatar
no policy change will make the aggregated co2 emissions of a century drop immediately year over year, first you have to roll the new emissions over, and that is what is happening, and at a pace climate scientists never anticipated. this is data showing that. ourworldindata.org/grapher/annu...
Annual CO₂ emissionsourworldindata.org Carbon dioxide (CO₂) emissions from fossil fuels and industry. Land-use change is not included.
Avatar
you keep posting charts that narrow the data, like US-only, or this one which excludes land uses. this is called cherry picking. it is also aggregated by humans, not a scientific measurement. when looked at the only number that matters, the *actual* scientific measurement, CO2 is accelerating.