nice little write-up here by @uptonorwell.bsky.social. in particular, the catplot command is one of Stata's better work-around for paired-grouping histograms, although you're bound by "bar-axis" options, which deploy a weird syntax suite that isnt super intuitive
see: medium.com/the-stata-ga...
i think the code is smoother in R, personally, but its clear enough with some work. the bigger issue imo is the scaling and kernaling in Stata doesn't always look great when printing to .pdf.
Thanks for the s/o, Nick! “catplot” is indeed very useful.
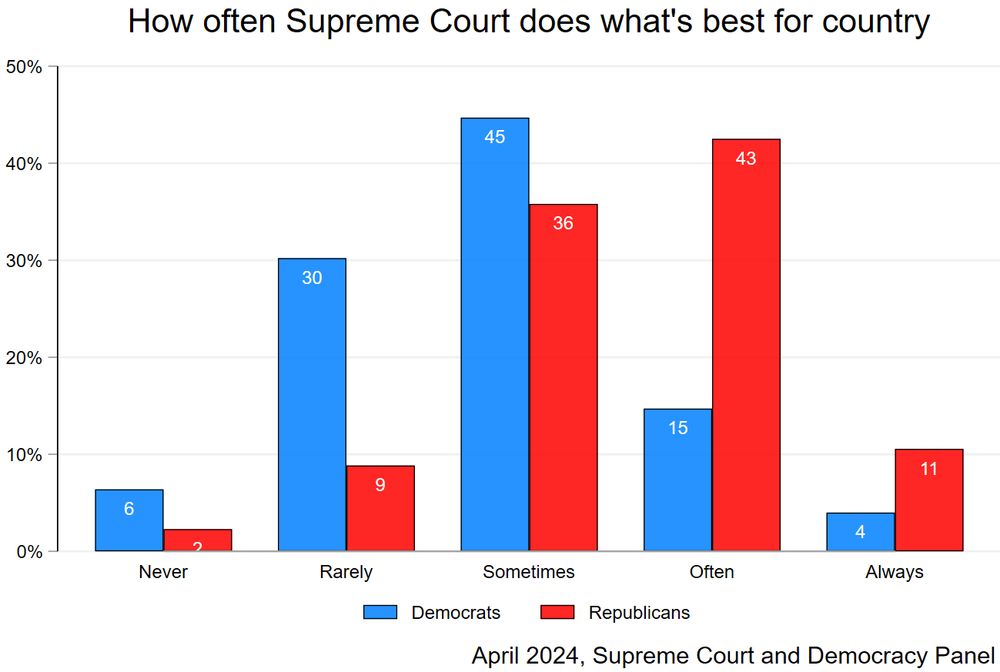
Graph looks great too! 👍 (result actually slightly less polarized than I might have guessed)
yeah, we'll see what happens after the immunity decision...hoping to get our fatalism questions back out again in the field in several weeks. We've started tinkering with the question wording for the locus-of-control Qs, and I think we'll pull some additional sorting on C-E with the changes.